關於Chart.js
Chart.js是一款彈性很高的圖表JavaScript library,支援八種常見的統計圖表類型,夠將圖表混合在一起使用,也支援動畫的效果,讓我們製作出來的圖表更加精美!
範例一 格線顏色與多線條

    var config = {
        type: 'line',
        data: {
            labels: ['January', 'February', 'March', 'April', 'May', 'June', 'July'],
            datasets: [{
                label: 'My First dataset',
                backgroundColor: window.chartColors.red,
                borderColor: window.chartColors.red,
                data: [10, 30, 39, 20, 25, 34, -10],
                fill: false,
            }, {
                label: 'My Second dataset',
                fill: false,
                backgroundColor: window.chartColors.blue,
                borderColor: window.chartColors.blue,
                data: [18, 33, 22, 19, 11, 39, 30],
            }]
        },
        options: {
            responsive: true,
            title: {
                display: true,
                text: 'Grid Line Settings'
            },
            scales: {
                yAxes: [{
                    gridLines: {
                        drawBorder: false,
                        color: ['pink', 'red', 'orange', 'yellow', 'green', 'blue', 'indigo', 'purple']
                    },
                    ticks: {
                        min: 0,
                        max: 100,
                        stepSize: 10
                    }
                }]
            }
        }
    };

    window.onload = function() {
        var ctx = document.getElementById('canvas').getContext('2d');
        window.myLine = new Chart(ctx, config);
    };
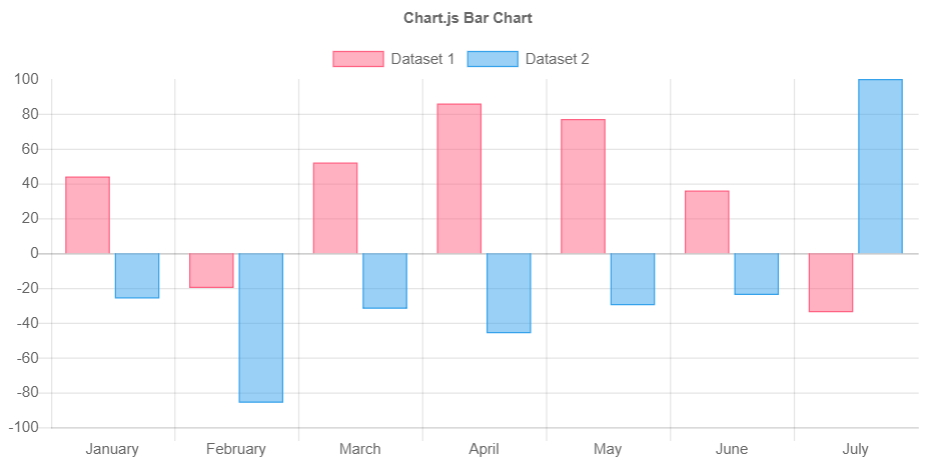
範例二 柱狀圖

    var MONTHS = ['January', 'February', 'March', 'April', 'May', 'June', 'July', 'August', 'September', 'October', 'November', 'December'];
    var color = Chart.helpers.color;
    var barChartData = {
        labels: ['January', 'February', 'March', 'April', 'May', 'June', 'July'],
        datasets: [{
            label: 'Dataset 1',
            backgroundColor: color(window.chartColors.red).alpha(0.5).rgbString(),
            borderColor: window.chartColors.red,
            borderWidth: 1,
            data: [
                randomScalingFactor(),
                randomScalingFactor(),
                randomScalingFactor(),
                randomScalingFactor(),
                randomScalingFactor(),
                randomScalingFactor(),
                randomScalingFactor()
            ]
        }, {
            label: 'Dataset 2',
            backgroundColor: color(window.chartColors.blue).alpha(0.5).rgbString(),
            borderColor: window.chartColors.blue,
            borderWidth: 1,
            data: [
                randomScalingFactor(),
                randomScalingFactor(),
                randomScalingFactor(),
                randomScalingFactor(),
                randomScalingFactor(),
                randomScalingFactor(),
                randomScalingFactor()
            ]
        }]

    };

    window.onload = function() {
        var ctx = document.getElementById('canvas').getContext('2d');
        window.myBar = new Chart(ctx, {
            type: 'bar',
            data: barChartData,
            options: {
                responsive: true,
                legend: {
                    position: 'top',
                },
                title: {
                    display: true,
                    text: 'Chart.js Bar Chart'
                }
            }
        });

    };

    document.getElementById('randomizeData').addEventListener('click', function() {
        var zero = Math.random() < 0.2 ? true : false;
        barChartData.datasets.forEach(function(dataset) {
            dataset.data = dataset.data.map(function() {
                return zero ? 0.0 : randomScalingFactor();
            });

        });
        window.myBar.update();
    });

    var colorNames = Object.keys(window.chartColors);
    document.getElementById('addDataset').addEventListener('click', function() {
        var colorName = colorNames[barChartData.datasets.length % colorNames.length];
        var dsColor = window.chartColors[colorName];
        var newDataset = {
            label: 'Dataset ' + barChartData.datasets.length,
            backgroundColor: color(dsColor).alpha(0.5).rgbString(),
            borderColor: dsColor,
            borderWidth: 1,
            data: []
        };

        for (var index = 0; index < barChartData.labels.length; ++index) {
            newDataset.data.push(randomScalingFactor());
        }

        barChartData.datasets.push(newDataset);
        window.myBar.update();
    });

    document.getElementById('addData').addEventListener('click', function() {
        if (barChartData.datasets.length > 0) {
            var month = MONTHS[barChartData.labels.length % MONTHS.length];
            barChartData.labels.push(month);

            for (var index = 0; index < barChartData.datasets.length; ++index) {
                // window.myBar.addData(randomScalingFactor(), index);
                barChartData.datasets[index].data.push(randomScalingFactor());
            }

            window.myBar.update();
        }
    });

    document.getElementById('removeDataset').addEventListener('click', function() {
        barChartData.datasets.splice(0, 1);
        window.myBar.update();
    });

    document.getElementById('removeData').addEventListener('click', function() {
        barChartData.labels.splice(-1, 1); // remove the label first

        barChartData.datasets.forEach(function(dataset) {
            dataset.data.pop();
        });

        window.myBar.update();
    });
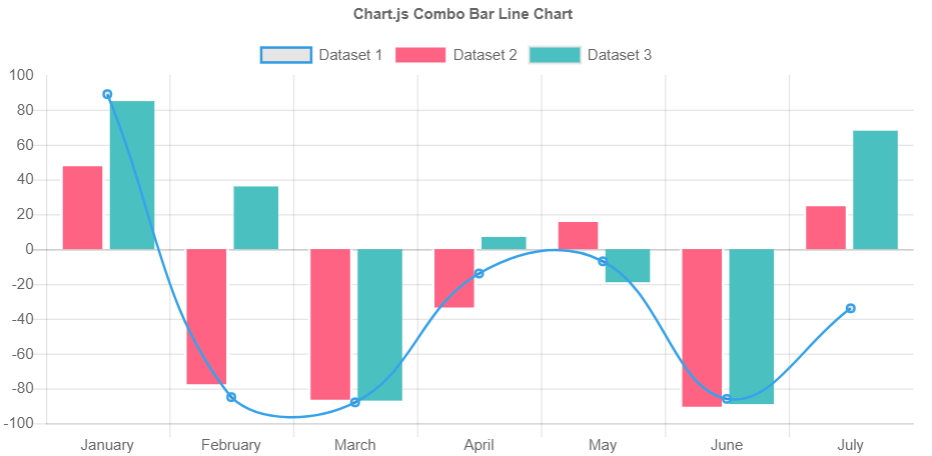
範例三 組合柱狀圖與線條

    var chartData = {
        labels: ['January', 'February', 'March', 'April', 'May', 'June', 'July'],
        datasets: [{
            type: 'line',
            label: 'Dataset 1',
            borderColor: window.chartColors.blue,
            borderWidth: 2,
            fill: false,
            data: [
                randomScalingFactor(),
                randomScalingFactor(),
                randomScalingFactor(),
                randomScalingFactor(),
                randomScalingFactor(),
                randomScalingFactor(),
                randomScalingFactor()
            ]
        }, {
            type: 'bar',
            label: 'Dataset 2',
            backgroundColor: window.chartColors.red,
            data: [
                randomScalingFactor(),
                randomScalingFactor(),
                randomScalingFactor(),
                randomScalingFactor(),
                randomScalingFactor(),
                randomScalingFactor(),
                randomScalingFactor()
            ],
            borderColor: 'white',
            borderWidth: 2
        }, {
            type: 'bar',
            label: 'Dataset 3',
            backgroundColor: window.chartColors.green,
            data: [
                randomScalingFactor(),
                randomScalingFactor(),
                randomScalingFactor(),
                randomScalingFactor(),
                randomScalingFactor(),
                randomScalingFactor(),
                randomScalingFactor()
            ]
        }]

    };
    window.onload = function() {
        var ctx = document.getElementById('canvas').getContext('2d');
        window.myMixedChart = new Chart(ctx, {
            type: 'bar',
            data: chartData,
            options: {
                responsive: true,
                title: {
                    display: true,
                    text: 'Chart.js Combo Bar Line Chart'
                },
                tooltips: {
                    mode: 'index',
                    intersect: true
                }
            }
        });
    };

    document.getElementById('randomizeData').addEventListener('click', function() {
        chartData.datasets.forEach(function(dataset) {
            dataset.data = dataset.data.map(function() {
                return randomScalingFactor();
            });
        });
        window.myMixedChart.update();
    });
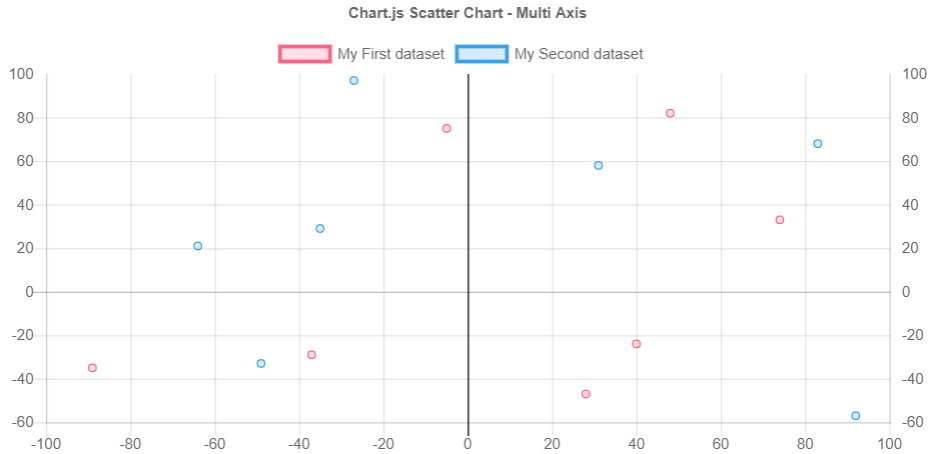
範例四 多點座標圖

var color = Chart.helpers.color;
var scatterChartData = {
    datasets: [{
        label: 'My First dataset',
        xAxisID: 'x-axis-1',
        yAxisID: 'y-axis-1',
        borderColor: window.chartColors.red,
        backgroundColor: color(window.chartColors.red).alpha(0.2).rgbString(),
        data: [{
            x: randomScalingFactor(),
            y: randomScalingFactor(),
        }, {
            x: randomScalingFactor(),
            y: randomScalingFactor(),
        }, {
            x: randomScalingFactor(),
            y: randomScalingFactor(),
        }, {
            x: randomScalingFactor(),
            y: randomScalingFactor(),
        }, {
            x: randomScalingFactor(),
            y: randomScalingFactor(),
        }, {
            x: randomScalingFactor(),
            y: randomScalingFactor(),
        }, {
            x: randomScalingFactor(),
            y: randomScalingFactor(),
        }]
    }, {
        label: 'My Second dataset',
        xAxisID: 'x-axis-1',
        yAxisID: 'y-axis-2',
        borderColor: window.chartColors.blue,
        backgroundColor: color(window.chartColors.blue).alpha(0.2).rgbString(),
        data: [{
            x: randomScalingFactor(),
            y: randomScalingFactor(),
        }, {
            x: randomScalingFactor(),
            y: randomScalingFactor(),
        }, {
            x: randomScalingFactor(),
            y: randomScalingFactor(),
        }, {
            x: randomScalingFactor(),
            y: randomScalingFactor(),
        }, {
            x: randomScalingFactor(),
            y: randomScalingFactor(),
        }, {
            x: randomScalingFactor(),
            y: randomScalingFactor(),
        }, {
            x: randomScalingFactor(),
            y: randomScalingFactor(),
        }]
    }]
};

window.onload = function() {
    var ctx = document.getElementById('canvas').getContext('2d');
    window.myScatter = Chart.Scatter(ctx, {
        data: scatterChartData,
        options: {
            responsive: true,
            hoverMode: 'nearest',
            intersect: true,
            title: {
                display: true,
                text: 'Chart.js Scatter Chart - Multi Axis'
            },
            scales: {
                xAxes: [{
                    position: 'bottom',
                    gridLines: {
                        zeroLineColor: 'rgba(0,0,0,1)'
                    }
                }],
                yAxes: [{
                    type: 'linear', // only linear but allow scale type registration. This allows extensions to exist solely for log scale for instance
                    display: true,
                    position: 'left',
                    id: 'y-axis-1',
                }, {
                    type: 'linear', // only linear but allow scale type registration. This allows extensions to exist solely for log scale for instance
                    display: true,
                    position: 'right',
                    reverse: true,
                    id: 'y-axis-2',

                    // grid line settings
                    gridLines: {
                        drawOnChartArea: false, // only want the grid lines for one axis to show up
                    },
                }],
            }
        }
    });
};

document.getElementById('randomizeData').addEventListener('click', function() {
    scatterChartData.datasets.forEach(function(dataset) {
        dataset.data = dataset.data.map(function() {
            return {
                x: randomScalingFactor(),
                y: randomScalingFactor()
            };
        });
    });
    window.myScatter.update();
});
範例五 圓餅圖

    var randomScalingFactor = function() {
        return Math.round(Math.random() * 100);
    };

    var config = {
        type: 'pie',
        data: {
            datasets: [{
                data: [
                    randomScalingFactor(),
                    randomScalingFactor(),
                    randomScalingFactor(),
                    randomScalingFactor(),
                    randomScalingFactor(),
                ],
                backgroundColor: [
                    window.chartColors.red,
                    window.chartColors.orange,
                    window.chartColors.yellow,
                    window.chartColors.green,
                    window.chartColors.blue,
                ],
                label: 'Dataset 1'
            }],
            labels: [
                'Red',
                'Orange',
                'Yellow',
                'Green',
                'Blue'
            ]
        },
        options: {
            responsive: true
        }
    };

    window.onload = function() {
        var ctx = document.getElementById('chart-area').getContext('2d');
        window.myPie = new Chart(ctx, config);
    };

    document.getElementById('randomizeData').addEventListener('click', function() {
        config.data.datasets.forEach(function(dataset) {
            dataset.data = dataset.data.map(function() {
                return randomScalingFactor();
            });
        });

        window.myPie.update();
    });

    var colorNames = Object.keys(window.chartColors);
    document.getElementById('addDataset').addEventListener('click', function() {
        var newDataset = {
            backgroundColor: [],
            data: [],
            label: 'New dataset ' + config.data.datasets.length,
        };

        for (var index = 0; index < config.data.labels.length; ++index) {
            newDataset.data.push(randomScalingFactor());

            var colorName = colorNames[index % colorNames.length];
            var newColor = window.chartColors[colorName];
            newDataset.backgroundColor.push(newColor);
        }

        config.data.datasets.push(newDataset);
        window.myPie.update();
    });

    document.getElementById('removeDataset').addEventListener('click', function() {
        config.data.datasets.splice(0, 1);
        window.myPie.update();
});更多範例展示Samples
許多參數設定可以研究Chart.js文件
